Use Industry Standards
RecyclingWorks has compiled industry data from published reports and studies, which can be used as guidance for facilities with little to no current food waste diversion program in place. The purpose of this tool is to help businesses and institutions in Massachusetts determine whether it is likely they are subject to the Massachusetts Commercial Food Waste Disposal Ban. Actual food waste generated can vary widely from one business to another. If your business is currently tracking or diverting food waste, you may dispose of less food waste than indicated by the industry averages.
We will continue to refine and add metrics as updated or improved data becomes available. This tool was last updated in November 2022. View a list of the sources used in developing our food waste estimation guide.
Individual results may vary depending on preparation methods and materials, reuse of leftovers, and type of food service. For example, a tray-less dining policy reduces post-consumer food waste in cafeterias compared with traditional tray service. In addition, the use of a garbage disposal, or similar technology, in a kitchen reduces the overall amount of food waste going into the trash.

Click on the industry sector listed below that best fits your business. For many sectors, you will see several methods of estimating food waste, based on factors such as how many meals you serve, how many employees you have, or how much total waste your business generates. Cross-check different methods to get the best estimate of how much food waste your business may generate.
Assisted Living Facilities
Colleges and Universities
Corporate Cafeterias
Correctional Facilities
Elementary and Secondary Schools
Hospitals
Lodging and Hotels
Restaurants
Supermarkets and Grocery Stores
Venues and Events
Assisted Living Facilities
Click here for a printable, fill-in version of this Commercial Food Waste Disposal Ban threshold estimation guide for nursing homes.
If you serve 1,667 meals in one week, then:
0.6 lbs/meal * 1,667 meals served/week = 1,000 lbs/week = 0.5 ton of food waste in one week
If you serve 5,000 lbs of food in one week, then:
20% of food served * 5,000 lbs served/week = 1,000 lbs/week = 0.5 ton of food waste in one week
If you have 80 beds, then:
1.8 lbs/bed/day * 80 beds = 144 lbs/day
144 lbs/day * 7 days/week = 1,008 lbs/week = 0.5 ton of food waste per week
If you have 110 employees, then:
475 lbs/employee/year * 110 employees = 52,250 lbs/year
52,250 lbs/year ÷ 52 weeks/year = 1,004 lbs/week = 0.5 ton of food waste per week
1 This metric uses beds as a proxy to account for all food waste generated across the nursing home by residents, staff, and visitors.
2 This metric uses the equivalent number of full-time employees as a proxy to account for all food waste generated across the nursing home by residents, staff, and visitors.
Colleges and Universities
Click here for a printable, fill-in version of this Commercial Food Waste Disposal Ban threshold estimation guide for colleges and universities.
If you have 212 students living on campus, then:
141.75 lbs/student/year * 212 residential students = 30,051 lbs/year
30,051 lbs/year ÷ 30 weeks/year = 1,002 lbs/week = 0.5 ton of food waste per week
If you have 800 students living off campus, then:
37.8 lbs/student/year * 800 non-residential students = 30,240 lbs/year
30,240 lbs/year ÷ 30 weeks/year = 1,008 lbs/week = 0.5 ton of food waste per week
Note: The equations based on number of students (above) assume a steady level of food consumption over a 30-week academic year. If this is not the case at your institution, the number of weeks should be adjusted to reflect your operations.
1 This metric assumes 405 meals per residential student per year.
2 This metric assumes 108 meals per non-residential student per year.
Back to top
Corporate Cafeterias
Click here for a printable, fill-in version of this Commercial Food Waste Disposal Ban threshold estimation guide for corporate cafeterias.
If you serve 1,600 meals in one week, then:
0.625 lbs/meal * 1,600 meals served/week = 1,000 lbs/week = 0.5 ton of food waste per week
1 0.625 lbs/meal is the median of EPA Corporate Cafeterias average estimate (range 0.5-0.75 lbs/meal).
Correctional Facilities
Click here for a printable, fill-in version of this Commercial Food Waste Disposal Ban threshold estimation guide for correctional facilities.
If you house 143 inmates, then:
1 lbs/meal * 143 inmates = 143 lbs/day
143 lbs/day * 7 days/week = 1,001 lbs/week = 0.5 ton of food waste per week
If you fill 1 trash dumpster at 8 cubic yards twice per week, then:
250 lbs1/yd3 * (1 trash dumpster * 8 yd3/trash dumpster * 2 pickups/week) = 4,000 lbs of total disposed waste/week
4,000 lbs/week * 30% of total waste = 1,200 lbs/week = 0.6 ton of food waste in one week
1 The equation based on weight of disposed waste assumes a weight of 250 lbs/yd3 waste. It is the lower range of the EPA’s standard conversion factor for uncompacted mixed MSW (residential, institutional, commercial): 1 yd3 mixed MSW = 250 to 300 lbs. You may choose to change this number to best represent your operations.
Elementary and Secondary Schools
Click here for a printable, fill-in version of this Commercial Food Waste Disposal Ban threshold estimation guide for elementary and secondary schools.
Note: RecyclingWorks now provides separate per-student estimates for elementary, middle, and high schools based on data from the Vermont Agency of Natural Resources. The elementary and middle school per student estimates are higher than the 0.5 lbs/student/week metric from an earlier version of this tool. Anecdotal observations suggest that a combination of changes in the National School lunch program, shorter lunch periods, and more frequent breakfast in the classroom offerings have contributed to more food waste, particularly in elementary schools. When estimating food waste at your school, also take into account whether your school has a culinary education program, a centralized kitchen serving other locations, or serves a high percentage of students school lunch (rather than lunch brought from home), as these may result in more food waste.
If you have 885 elementary school students, then:
1.13 lbs/student/week * 885 students = 1,000 lbs/week = 0.5 ton of food waste per week
If you have 1,370 middle school students, then:
0.73 lbs/student/week * 1,370 students = 1,000 lbs/week = 0.5 ton of food waste per week
If you have 2,860 high school students, then:
0.35 lbs/student/week * 2,860 students = 1,001 lbs/week = 0.5 ton of food waste per week
If you fill 1 trash dumpster at 10 cubic yards 1 time per week, then:
2501 lbs/yd3 * (1 trash dumpster * 10 yd3/trash dumpster * 1 pickup/week) = 2,500 lbs of total disposed waste/week
2,500 lbs * 45% of total waste = 1,125 lbs/week = 0.6 ton of food waste in one week
1 The equation based on weight of disposed waste assumes a weight of 250 lbs/yd3 waste. It is the lower range of the EPA’s standard conversion factor for uncompacted mixed MSW (residential, institutional, commercial): 1 yd3 mixed MSW = 250 to 300 lbs. You may choose to change this number to best represent your operations.
Hospitals
Click here for a printable, fill-in version of this Commercial Food Waste Disposal Ban threshold estimation guide for hospitals.
If you serve 1,667 meals in one week, then:
0.6 lbs/meal * 1,667 meals served/week = 1,000 lbs/week = 0.5 ton of food waste in one week
If you serve 3,333 lbs of food in one week, then:
30% of food served * 3,333 lbs served/week = 1,000 lbs/week = 0.5 ton of food waste in one week
If you have 42 beds, then:
3.42 lbs/bed/day * 42 beds = 144 lbs/day
144 lbs/day * 7 days/week = 1,008 lbs/week = 0.5 ton of food waste per week
If you have 180 full-time employees, then:
290 lbs/employee/year * 180 employees = 52,200 lbs/year
52,200 lbs/year ÷ 52 weeks/year = 1,004 lbs/week = 0.5 ton of food waste per week
1 This metric uses beds as a proxy to account for all food waste generated across the hospital by patients, staff, and visitors.
2 290 lbs/employee/year is CalRecycle’s 2014 estimate. This metric uses the equivalent number of full-time employees for the entire hospital as a proxy to account for all food waste generated across the hospital by patients, staff, and visitors.
Lodging and Hotels
Click here for a printable, fill-in version of this Commercial Food Waste Disposal Ban threshold estimation guide for lodging and hotels.
Note: Hotels that do not provide food service will typically generate less food waste than indicated in the below metrics. Therefore, you may choose to change these measures to best represent your operations.
If you have 143 guests per day, then:
1 lbs/guest/day * 143 guests = 143 lbs/day
143 lbs/day * 7 days/week = 1,001 lbs/week = 0.5 ton of food waste per week
If you have 150 guest rooms, then:
345.64 lbs/room/year * 150 rooms = 51,846 lbs/year
51,846 lbs/year ÷ 52 weeks/year = 997 lbs/week = 0.5 ton of food waste per week
If you fill 1 trash dumpster at 6 cubic yards two times per week, then:
2501 lbs/yd3 * (1 trash dumpster * 6 yd3/trash dumpster * 2 pickups/week) = 3,000 lbs of total disposed waste/week
3,000 lbs * 36% of total waste = 1,080 lbs/week = 0.5 ton of food waste in one week
If you have 40 employees, then:
1,305 lbs/employee/year * 40 employees = 52,200 lbs/year
52,200 lbs/year ÷ 52 weeks/year = 1,004 lbs/week = 0.5 ton of food waste per week
1 The equation based on weight of disposed waste assumes a weight of 250 lbs/yd3 waste. It is the lower range of the EPA’s standard conversion factor for uncompacted mixed MSW (residential, institutional, commercial): 1 yd3 mixed MSW = 250 to 300 lbs. You may choose to change this number to best represent your operations.
2 This metric uses the equivalent number of full-time employees for the entire hotel as a proxy to account for all food waste generated across the hotel by staff, guests, and other patrons.
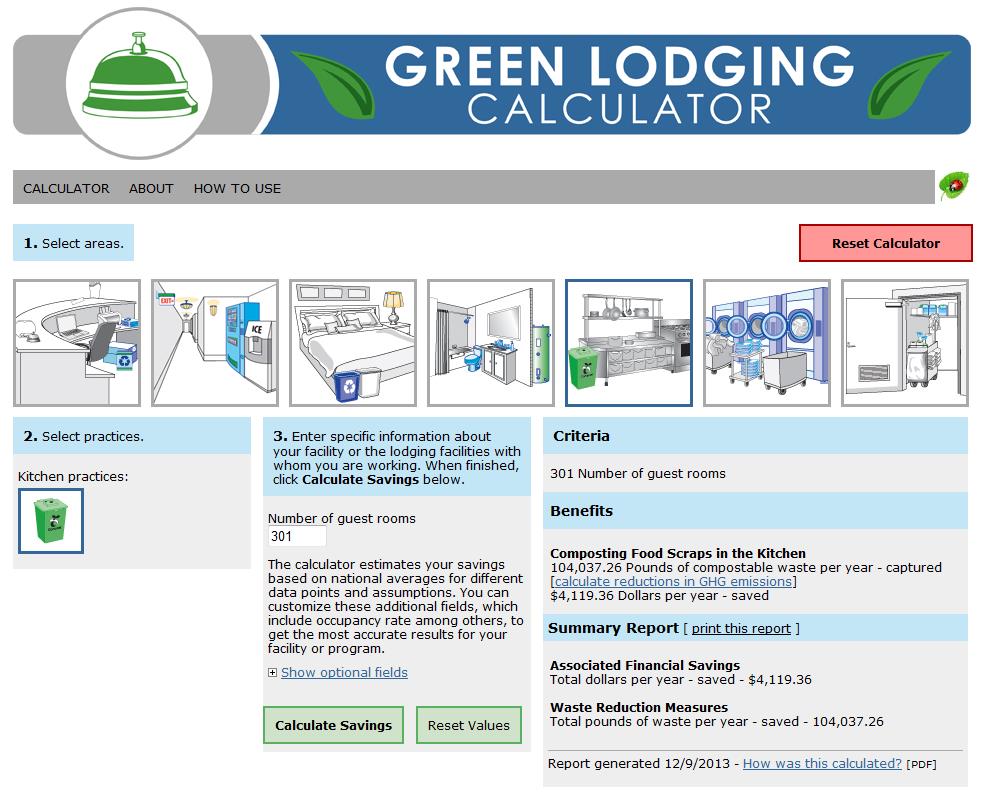
Tip: The Northeast Waste Management Officials’ Association (NEWMOA) has developed a Green Lodging Calculator that estimates environmental benefits and financial savings from various sustainable practices tailored to the hospitality industry.
Restaurants
Click here for a printable, fill-in version of this Commercial Food Waste Disposal Ban threshold estimation guide for restaurants.
Note: RecyclingWorks now breaks out all forms of estimating food waste by the NAICS code definition for limited and full-service restaurants. Limited-Service Restaurants (NAICS 722211) are defined as “establishments primarily engaged in providing food services … where patrons generally order or select items and pay before eating.” Full-Service Restaurants (NAICS 722511) are defined as “establishments primarily engaged in providing food services to patrons who order and are served while seated … and pay after eating. Actual food waste generation rates within each of these categories can vary widely. Factors such as whether your establishment prepares food from scratch, offers buffet-style dining, or has mostly patrons that eat-in can contribute to higher amounts of food waste. Take into account your restaurant’s operations when considering which metric to use.
If you are a full-service restaurant serving 1,000 meals in one week, then:
1 lbs/meal * 1,000 meals served/week = 1,000 lbs/week = 0.5 ton of food waste per week
If you are a limited-service restaurant serving 2,000 meals in one week, then:
0.5 lbs/meal * 2,000 meals served/week = 1,000 lbs/week = 0.5 ton of food waste per week
If you are a full-service restaurant with 17 employees, then:
3,000 lbs/employee/year * 17 full-time employees = 51,000 lbs food waste generated/year
51,000 lbs/year ÷ 52 weeks/year = 981 lbs/week = 0.5 ton of food waste per week
If you are a limited-service restaurant with 24 employees, then:
2,200 lbs/employee/year * 24 full-time employees = 52,800 lbs food waste generated/year
52,800 lbs/year ÷ 52 weeks/year = 1,015 lbs/week = 0.5 ton of food waste per week
If you are a full-service restaurant and fill 1 trash dumpster at 6 cubic yards 1 time per week, then:
2501 lbs/yd3 * (1 trash dumpster * 6 yd3/trash dumpster * 1 pickup/week) = 1,500 lbs of total disposed waste/week
1,500 lbs * 66% of total waste = 990 lbs/week = 0.5 ton of food waste in one week
If you are a fast-food restaurant and fill 1 trash dumpster at 8 cubic yards 1 time per week, then:
2501 lbs/yd3 * (1 trash dumpster * 8 yd3/trash dumpster * 1 pickup/week) = 2,000 lbs of total disposed waste/week
2,000 lbs * 51% of total waste = 1,020 lbs/week = 0.5 ton of food waste in one week
1 The equation based on weight of disposed waste assumes a weight of 250 lbs/yd3 waste. It is the lower range of the EPA’s standard conversion factor for uncompacted mixed MSW (residential, institutional, commercial): 1 yd3 mixed MSW = 250 to 300 lbs. You may choose to change this number to best represent your operations.
Supermarkets and Grocery Stores
Click here for a printable, fill-in version of this Commercial Food Waste Disposal Ban threshold estimation guide for supermarkets and grocery stores.
If you have 17 full-time employees, then:
3,000 lbs/employee/year * 17 full-time employees = 51,000 lbs food waste generated/year
51,000 lbs/year ÷ 52 weeks/year = 981 lbs/week = 0.5 ton of food waste per week
If you fill 1 trash dumpster at 8 cubic yards 1 time per week, then:
2501 lbs/yd3 (1 trash dumpster * 8 yd3/trash dumpster * 1 pickup/week) = 2,000 lbs of total disposed waste/week
2,000 lbs * 63% of total waste = 1,260 lbs/week = 0.6 ton of food waste in one week
1 The equation based on weight of disposed waste assumes a weight of 250 lbs/yd3 waste. It is the lower range of the EPA’s standard conversion factor for uncompacted mixed MSW (residential, institutional, commercial): 1 yd3 mixed MSW = 250 to 300 lbs. You may choose to change this number to best represent your operations.
Venues and Events
Click here for a printable, fill-in version of this Commercial Food Waste Disposal Ban threshold estimation guide for venues and events.
For resorts and conference properties:
If you have 238 seats, then:
0.6 lbs/seat/day * 238 seats = 143 lbs/day
143 lbs/day * 7 days/week = 1,001 lbs/week = 0.5 ton of food waste per week
If you serve 1,000 meals in one week, then:
1 lbs/meal * 1,000 meals served/week = 1,000 lbs/week = 0.5 ton of food waste in one week
For large venues and events2:
If you have 2,222 visitors in one week, then:
0.45 lbs/visitor * 2,222 visitors = 1,000 lbs = 0.5 ton of food waste in one week
If you fill 2 trash dumpsters at 4 cubic yards 2 times per week, then:
2501 lbs/yd3 * (2 trash dumpsters * 4 yd3 * 2 pickups/week) = 4,000 lbs of total disposed waste/week
4,000 lbs * 25% of total waste = 1,000 lbs/week = 0.5 ton of food waste in one week
1 The equation based on weight of disposed waste assumes a weight of 250 lbs/yd3 waste. It is the lower range of the EPA’s standard conversion factor for uncompacted mixed MSW (residential, institutional, commercial): 1 yd3 mixed MSW = 250 to 300 lbs. You may choose to change this number to best represent your operations.
2 Large venues and events include convention centers, stadiums, theme parks, performing art centers, movie theaters, fairgrounds, special event sites (e.g. parades, sporting events, festivals), and miscellaneous venues (e.g. museums, zoos).
Sources for Business Sector Estimates
California Department of Resources Recycling and Recovery (CalRecycle). Business Group Waste Stream Calculator. 2016
https://www2.calrecycle.ca.gov/WasteCharacterization/BusinessGroupCalculator
Cascadia Consulting Group. Waste Disposal and Diversion Findings for Selected Industry Groups. No. 341-2006-0006. California Environmental Protection Agency, June 2006.
https://www2.calrecycle.ca.gov/Publications/Details/1184.
Florida Department of Environmental Protection. Waste Reduction and Recycling Guide for Florida Correctional Facilities. Kessler Consulting, Inc., Jan. 2004.
http://www.businessperformance.org/sites/default/files/finalprisonguide-72ppi.pdf.
Food Waste Reduction Alliance. Analysis of U.S. Food Waste Among Food Manufacturers, Retailers, and Wholesalers. BSR, Apr. 2013. http://www.foodwastealliance.org/wp-content/uploads/2013/06/FWRA_BSR_Tier2_FINAL.pdf.
Massachusetts Department of Environmental Protection. Identification, Characterization, and Mapping of Food Waste and Food Waste Generators In Massachusetts. Draper/Lennon, Inc., Sept. 2002. https://www.mass.gov/doc/study-identification-characterization-mapping-of-food-waste-generators-in-massachusetts-2002/download.
Massachusetts Restaurant Association. Interview by Massachusetts Department of Environmental Protection. 2013.
Natural Resources Defense Council (NRDC). Estimating Quantities and Types of Food Waste at the City Level. October 2017. https://www.nrdc.org/sites/default/files/food-waste-city-level-report.pdf
Nichols, P., C. Porter, L. Hammond, and B. Arjmandi. “Food Intake May Be Determined by Plate Waste in a Retirement Living Center.” Journal of the American Dietetic Association 102.8 (2002): 1142-144.
Northeast Waste Management Official’s Association (NEWMOA). From Behavior Change to Environmental Outcomes In Sustainable Hospitality: Metrics, Formulas, Variables, & Assumptions. June 2011. http://www.newmoa.org/prevention/projects/hospitality/ From_Behavior_Change_to_Environmental_Outcomes.pdf.
ReFED. A Roadmap to Reduce US Food Waste by 20%. Report: Technical Appendix. 2016. https://www.refed.com/downloads/ReFED_Technical_Appendix.pdf
United States Environmental Protection Agency. Food Waste Management Cost Calculator. 2009. https://www.epa.gov/sites/production/files/2017-01/foodcost3.xls
Vermont Agency of Natural Resources. Food Scrap Generator Database Calculations. May 2014. http://anrmaps.vermont.gov/websites/Organics/documents/FoodScrapGeneration_Calculations-Final.pdf
Williams, Peter G., and Karen Walton. “Plate Waste in Hospitals and Strategies for Change.” E-SPEN – The European E-journal of Clinical Nutrition and Metabolism 6th Ser. 6 (2011).
WRAP. Overview of waste in the hospitality and food service sector. November 2013. https://wrap.org.uk/resources/report/overview-waste-hospitality-and-food-service-sector